Terminal Viewer (TUI)
strata-notebook-tui is a read-only terminal spectator for a live notebook
session. It attaches to a running strata-notebook server over the same
WebSocket protocol the web UI uses, then renders the notebook and streams every
update - cell status changes, console output, results, cascade and
environment-job progress, and an AI agent's activity - as they happen.
It does not edit or run cells. Its purpose is watching: open a notebook in the web UI (or let an AI agent drive it), and follow along in a terminal - a second pane, an SSH session, or a tmux window beside your editor.
This is the terminal quickstart. Something else has to be driving the notebook - either you in the web UI, or a coding agent.
Install
The viewer ships behind the tui extra (it pulls in textual and grandalf,
plus textual-image and Pillow for inline image rendering; httpx and
websockets are already core dependencies):
uv tool install "strata-notebook[tui]"      # global: strata-notebook, strata-notebook-tui, strata, strata-worker
# or, inside a project venv:
uv pip install "strata-notebook[tui]"
Plain strata-notebook (without [tui]) installs the server but not the
viewer's dependencies, so strata-notebook-tui will fail to start.
Workflow
The viewer is a client - you always have a server, a session, and the viewer watching it.
1. Start the server
The server opens only notebooks inside its storage root, which defaults to
~/.strata/notebooks. --notebook-dir . makes the current directory the
root, so the notebook created in step 2 can be opened.
2. Have a notebook
Scaffold one from the terminal, in the same directory:
…or create / open one in the web UI at :8765. (strata-notebook-tui can open
an existing notebook directory itself - see --notebook below - but it can't
create one.)
3. Watch it
Or, if a session is already open (for example you opened the notebook in the web UI), attach without naming it:
The strata CLI wraps the same spectator as strata watch, so you don't need
the separate binary on PATH:
strata watch ./my-notebook     # open/reuse a session for that path, then attach
strata watch --session <id>    # attach to a specific running session
strata watch                   # auto-attach the only session, or show a picker
--server URL names the server, as for strata-notebook-tui (default
$STRATA_TUI_SERVER or http://localhost:8765).
strata watch is watch-only: unlike strata agent, it writes no
.mcp.json / CLAUDE.md and never owns the server lifecycle - it just shows a
notebook live. Point it at a scratchpad an agent is driving to see the cells land
in real time.
Watching an agent
The viewer's headline use case is following an agent as it drives a notebook somewhere else.
A coding agent in another terminal
A coding agent - Claude Code, or anything that can run a command - drives the notebook through the CLI while you watch it happen:
strata-notebookin one terminal, and open the notebook.strata-notebook-tuiin a second, pointed at it.- In a third, let the agent work, giving it
--server/--sessionrather than the notebook path (this is what the scratchpad skill tells it to do).
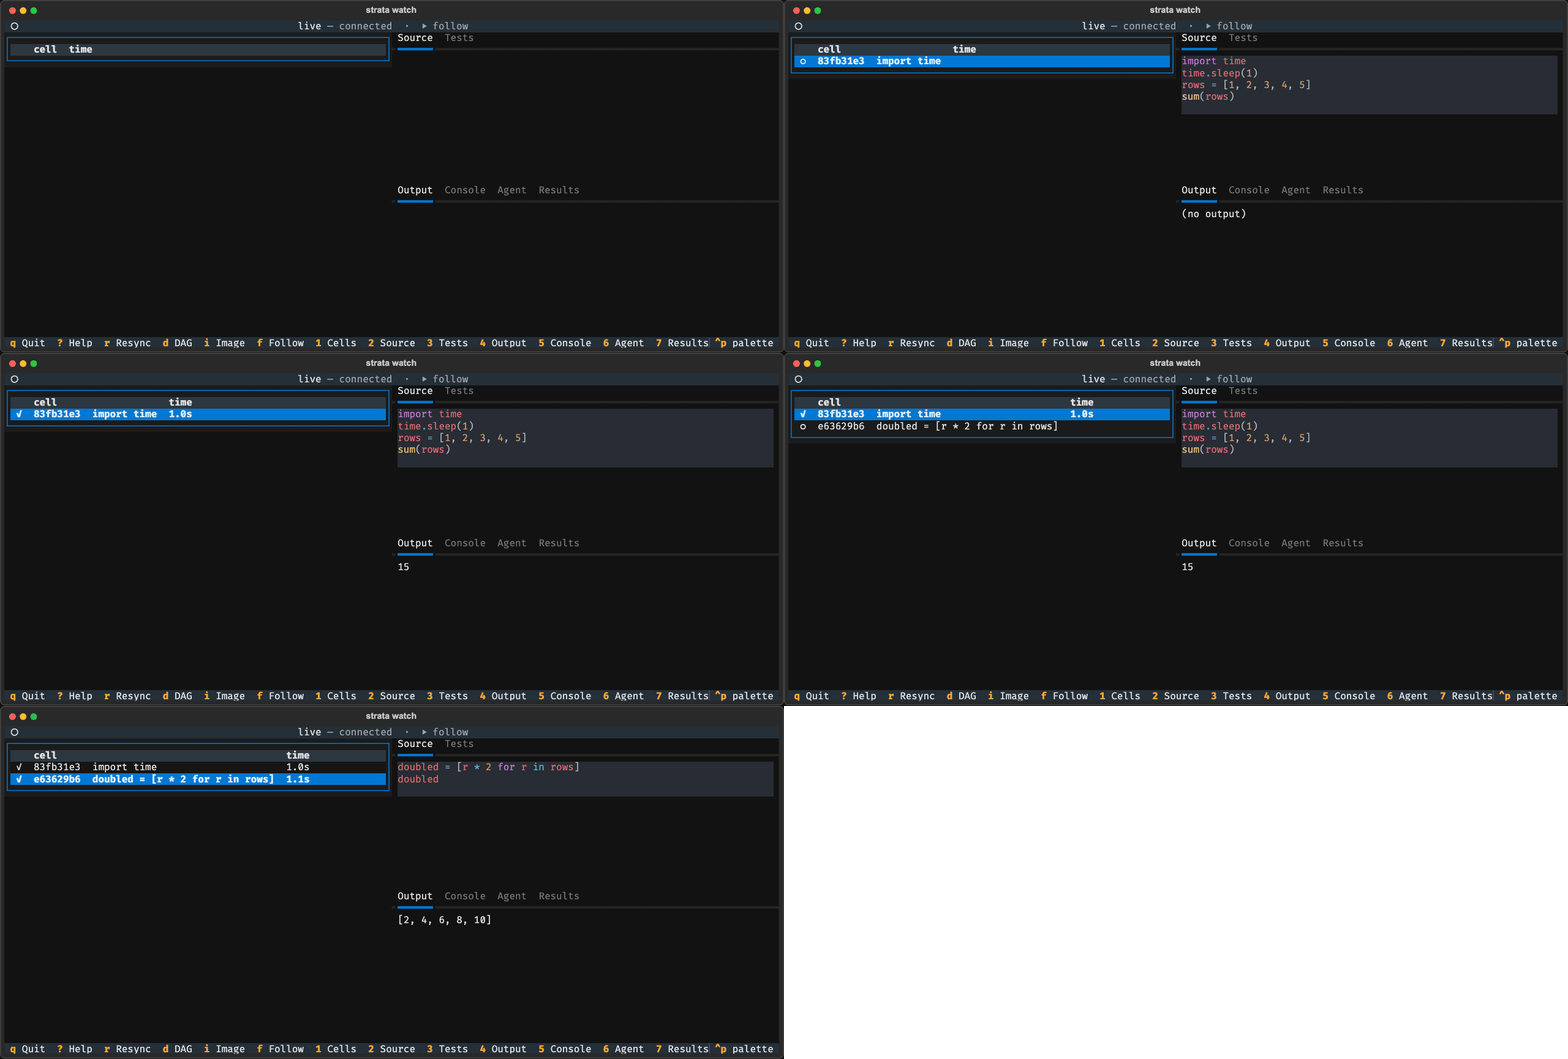
Cells appear, flip to running, and report their output as the agent works - nothing to refresh, and no need to share the agent's terminal. The selector is what makes it live: given a notebook path the same commands edit files on disk and the viewer sees nothing, which is the distinction the CLI page draws.
The Agent tab
An agent driving the notebook over MCP narrates its tool actions
("ran cell abc → ok", "added dependency polars") and any note it posts with the
note tool into the Agent tab, so you can follow why it is doing something
as well as what it changed.
Layout and keys
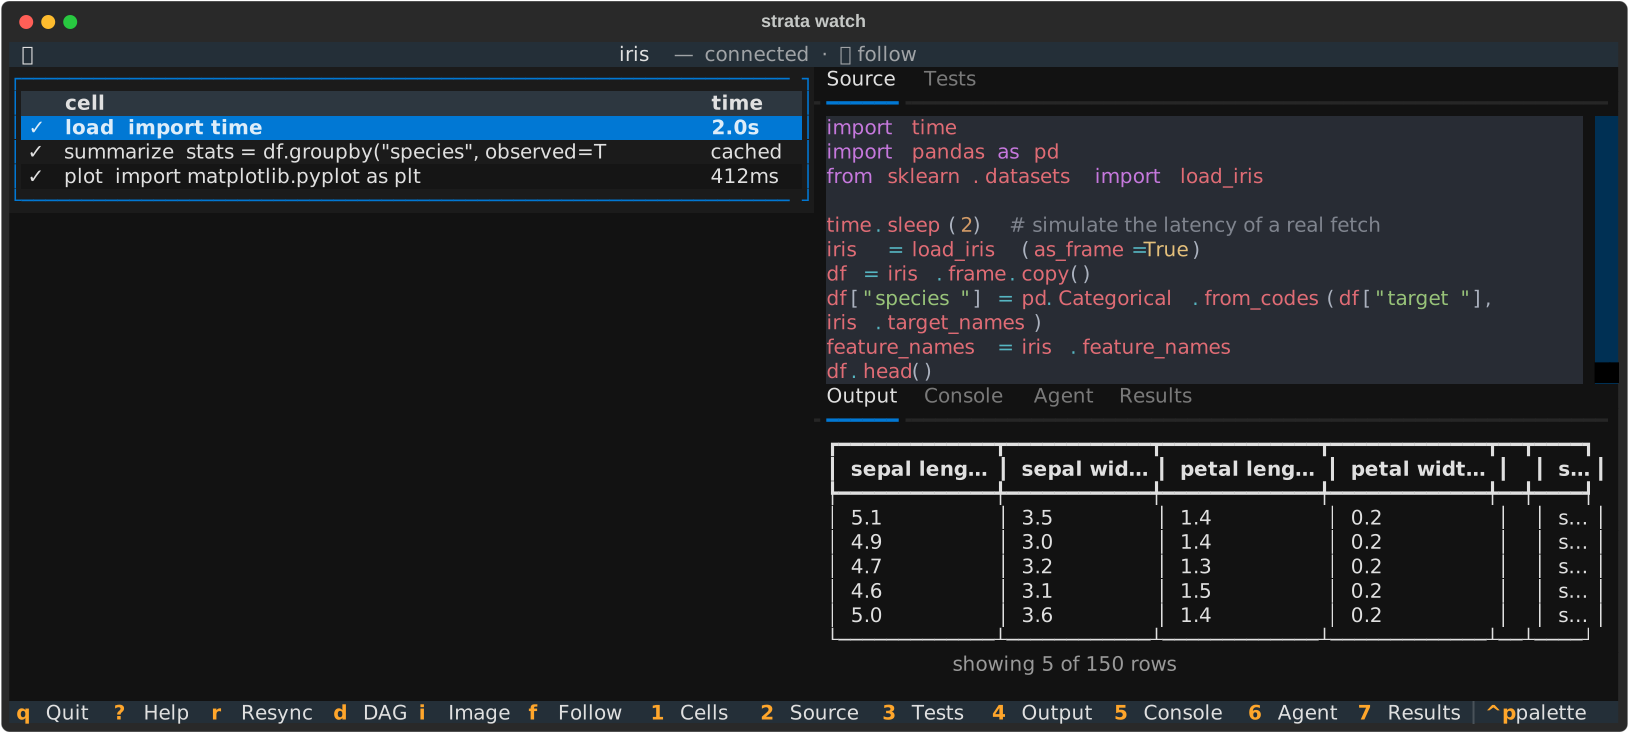
The left pane lists the cells (status glyph, name, and last-run time); the right pane is split into two tab-groups for the selected cell - the code on top (Source, Tests source) and the runtime on the bottom (Output, Console, Agent, Results). A header line shows the connection state, follow mode, and any cascade / environment / agent activity.
When the driver runs a cell's unit tests, the result shows as a
badge on that cell in the list - ✓ 4/4 (green), ✗ 2/4 on failure, ·stale
when the cell changed since the run - and the header notes the test run. The
top Tests tab (3) shows the test source; the bottom Results tab (7)
shows the individual outcomes for the selected cell: each test as ✓/✗/⚠/○
with its failure message (the rewritten-assert diff) underneath - the pytest run,
in the terminal.
| Key | Action |
|---|---|
1 |
Focus the cell list (↑/↓ move the selection) |
2 / 3 |
Top group: Source / Tests source |
4 / 5 / 6 / 7 |
Bottom group: Output / Console / Agent / Results |
↑ ↓ PgUp PgDn Home End |
Scroll the focused pane |
n / p |
Data viewer: next / previous page of a large table |
s |
Data viewer: sort by the focused column (asc → desc → off) |
e |
Data viewer: export the table to a CSV in the current directory |
f |
Toggle follow mode (auto-select the running cell) |
d |
Show the notebook DAG (layered ASCII; Esc/d/q to close) |
i |
Enlarge the selected cell's image output to full screen (Esc/i/q to close) |
r |
Force an immediate resync (the viewer also auto-resyncs in the background); after the server closed the session, reopen it |
[ / ] |
Resize the cell-list ↔ detail boundary (narrower / wider list) |
- / = |
Resize the top ↔ bottom detail boundary (shorter / taller top) |
\ |
Reset the panel layout to defaults |
? |
Show the keybinding reference (Esc/?/q to close) |
q |
Quit |
The tabs render richly: source is syntax-highlighted by cell language,
markdown cells and markdown outputs render as formatted markdown, a single DataFrame / table output
renders in an interactive data viewer - a scrollable table you can page (n/p),
sort by the focused column (s), and export to CSV (e), backed by the full
cached artifact rather than the 20-row preview - and image outputs (e.g.
matplotlib figures) render inline - using the terminal's graphics protocol
(kitty / iTerm2 / Sixel) where available, degrading to Unicode half-blocks
otherwise.
Cell status glyphs:
| Glyph | Status |
|---|---|
○ |
idle |
▶ |
running |
✓ |
ready |
✗ |
error |
⊘ |
stale |
… |
queued |
Watching a re-run
The last-run time is where caching becomes visible. Edit one cell and run: the cells above it resolve from cache without executing, and only the edited one computes.
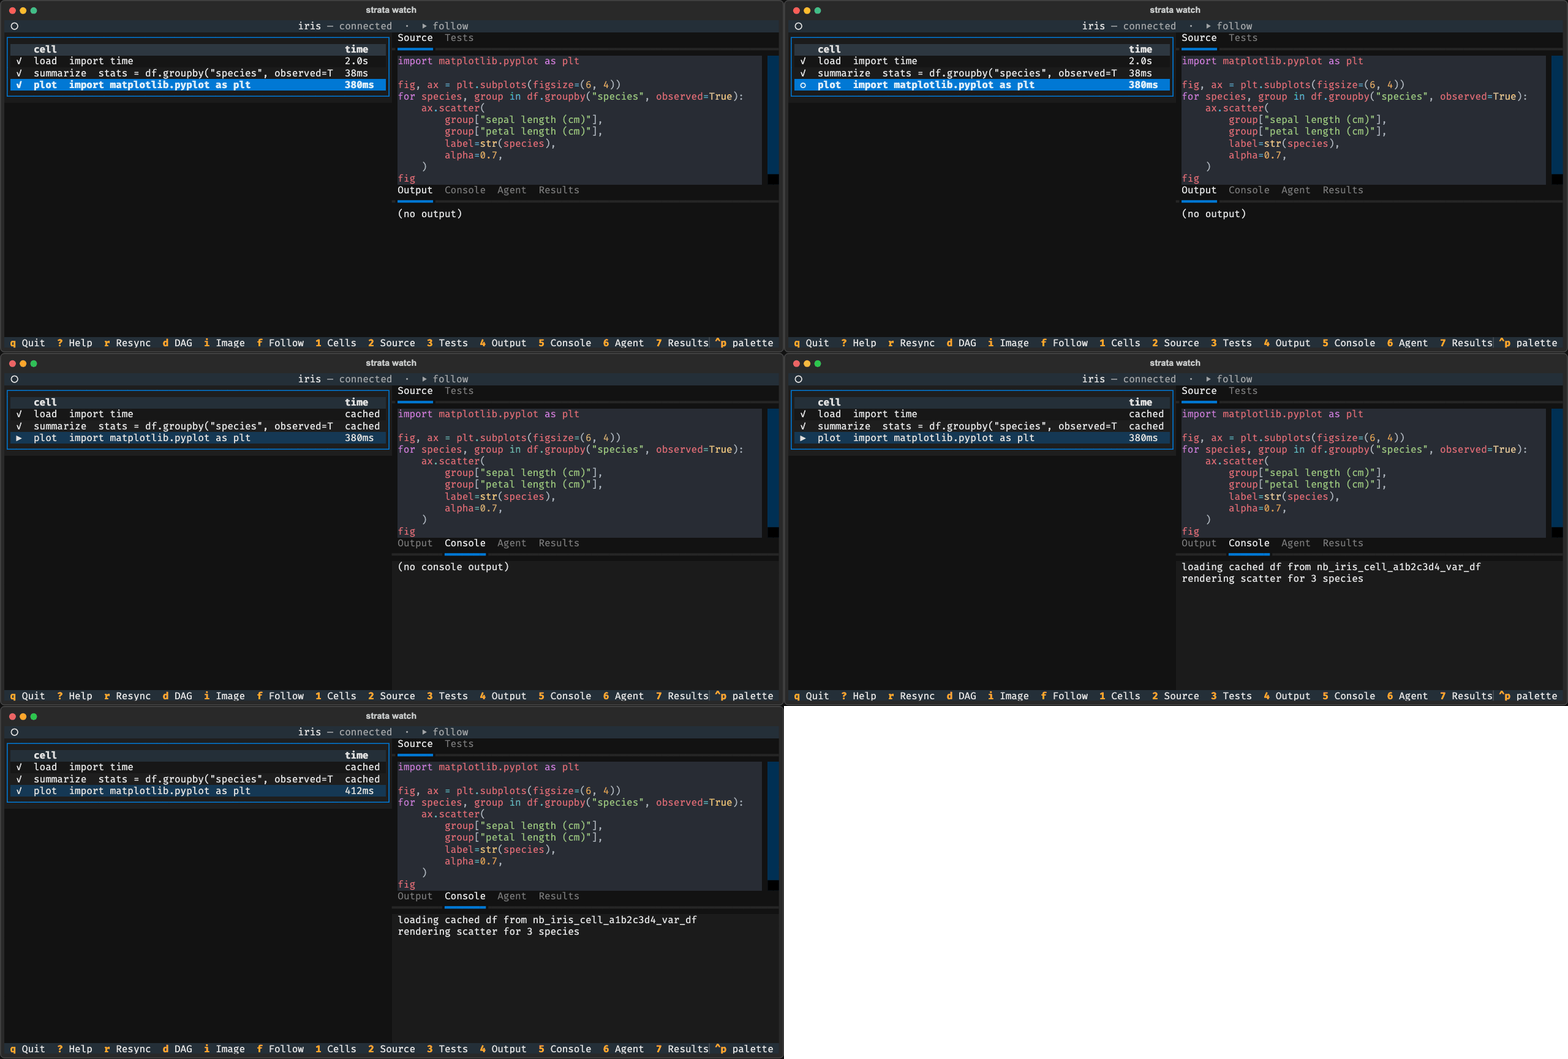
load sleeps two seconds on purpose in the
quickstart; that is what makes the point
legible. It is the step you would notice re-running, and it does not.
When the server closes the session
The server closes a session nobody has used for a while, when too many are
open, when memory runs low, or when someone closes or deletes the notebook (see
Session lifetime).
The viewer then stops reconnecting, shows why in a notification, and keeps
session closed (<reason>) in its header. Unless the notebook was deleted, its
results stay on disk.
A restarted server no longer has the session and refuses the viewer's
reconnect. The viewer then stops retrying and shows
session closed (not found) the same way.
If the viewer knows the notebook's path (you passed --notebook, or it
attached a session from the list or the picker), press r to reopen it as a
new session and keep watching. Attached with --session ID, it does not know
the path: run strata watch PATH (or open the notebook in the web UI) to start
a new session.
Options
| Option | Purpose |
|---|---|
--session ID |
Attach to a specific running session id (skips the picker). |
--notebook PATH |
Open / reuse a session for a notebook directory path (the path must exist on the server's filesystem). |
--server URL |
Base URL of the server (default: $STRATA_TUI_SERVER or http://localhost:8765). |
Authentication
No auth flags are needed: a personal server has one user. Point at a
non-default server with --server (or the STRATA_TUI_SERVER environment
variable). See Privacy & Sharing for who can reach
a notebook.